
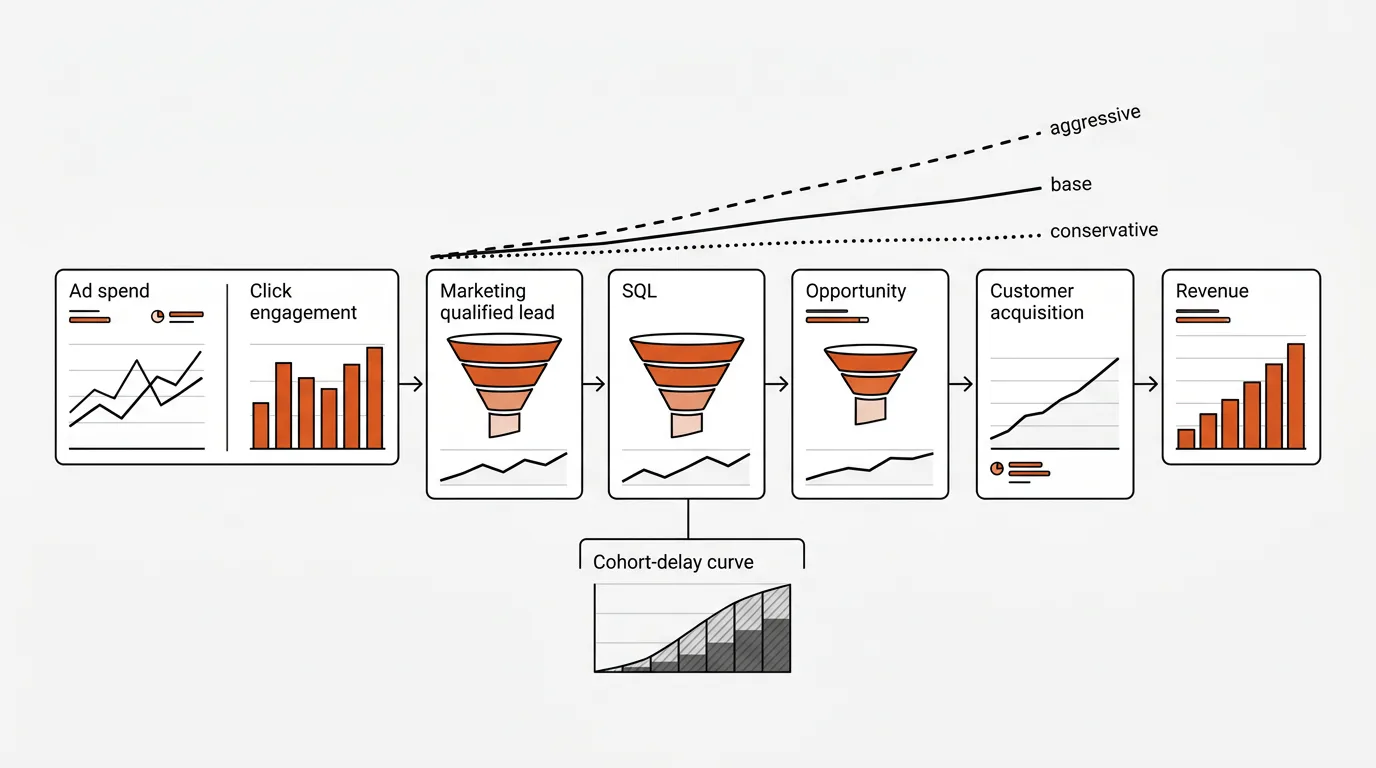
Marketing forecasting works when the model connects media spend to customers and revenue, not when it stops at leads. Build a historical baseline, map every funnel stage, account for cohort delay, compare actual pacing with plan, and run conservative, base, and aggressive scenarios before deciding whether the next dollar should be spent.
What marketing forecasting should tell you
A marketing forecast should tell the team what spend is expected to produce, when the result should arrive, which assumptions carry the most risk, and what action to take when actual performance moves off plan. It is a decision model, not a polished spreadsheet that nobody checks after the budget meeting.
The forecast needs to connect five layers:
- Media: spend, impressions, clicks, and cost per click
- Lead generation: inquiries, calls, sign-ups, or marketing-qualified leads
- Sales qualification: SQLs, attended calls, opportunities, or another verified stage
- Customers: closed deals, admissions, subscriptions, or purchases
- Revenue: first purchase, annual contract value, collected revenue, or lifetime value
If the model ends at cost per lead, it cannot explain whether cheaper leads became worse customers. If it starts at a revenue target but hides the conversion assumptions required to reach it, the number is a wish.
Marketing forecasting model at a glance
A practical model uses historical rates to calculate each stage, then adjusts those rates for known changes and uncertainty.
| Forecast layer | Core inputs | Output | Main risk |
|---|---|---|---|
| Spend and traffic | Budget, CPC, click-through rate | Clicks and visits | Auction costs or mix changes |
| Lead creation | Visit-to-lead conversion rate | Leads or MQLs | Page, offer, or traffic quality shifts |
| Qualification | MQL-to-SQL or call-to-opportunity rate | Qualified pipeline | Definitions and sales follow-up vary |
| Customer conversion | Opportunity-to-customer rate | New customers | Cohorts have not fully matured |
| Revenue | Customers, contract value, LTV | Revenue and ROAS | Revenue assumptions are stale or blended |
Give each row an owner, a source, and a refresh cadence. Marketing owns traffic assumptions, sales owns qualification, and finance confirms the revenue definition.
Step 1: build a historical baseline
The baseline is the reference case before planned optimizations. Pull 12 to 24 months of data when it is available, then segment it so one blended average does not hide important differences.
Useful segments include:
- Brand versus non-brand
- Channel and campaign type
- Geography
- Product or service line
- New versus existing customer
- Device when behavior differs materially
- Customer type or deal-size band
A blended paid-search CPA can look stable while brand spend improves and non-brand acquisition declines. The total is technically correct and operationally useless.
Start with monthly data, then keep a weekly view for pacing. If the business has strong seasonality, compare each month with the same period in the prior year rather than assuming the previous month represents the next one.
When you have less than 12 months of history
A newer business can still forecast, but it should show wider ranges and fewer claims. Use verified funnel rates, known budget constraints, sales capacity, and current auction costs. Update the model more often, and do not use one unusually strong month as the permanent base case.
Step 2: map the full funnel and its conversion rates
A full-funnel marketing forecast calculates the movement between every material stage. The exact labels differ by business, but the logic stays the same.
For B2B lead generation, a model might use:
| Stage | Formula |
|---|---|
| Clicks | Spend ÷ CPC |
| MQLs | Clicks × visit-to-MQL rate |
| SQLs | MQLs × MQL-to-SQL rate |
| Opportunities | SQLs × SQL-to-opportunity rate |
| Customers | Opportunities × close rate |
| Revenue | Customers × average revenue per customer |
| CAC | Spend ÷ customers |
Definitions matter as much as formulas. If one sales rep marks every booked call as qualified and another waits for confirmed budget and authority, the MQL-to-SQL rate is not a stable input.
Write the rule for each stage. Then audit whether the CRM applies it consistently. Our Google Ads conversion action framework explains how the same depth-versus-volume tradeoff affects paid-media bidding.
Step 3: account for cohort bake and conversion lag
Cohort bake is the time a group of leads needs to mature through the funnel. A campaign can look weak today because the leads have not had enough time to become opportunities or customers. It can also look strong because early leads are arriving while downstream quality is still unknown.
Google calls the platform version conversion lag: the delay between an ad interaction and the recorded conversion. Its conversion lag reporting guide explains that recent CPA can look inflated and ROAS can look deflated before delayed conversions arrive. Our guide to nine Google Ads metrics most teams miss shows how to pair lag with customer mix, view-through results, impression share, and auction pressure.
Your business forecast has to go further than the platform. It should model the lag between MQL, SQL, opportunity, close, and revenue.
Worked cohort example
Assume a March campaign produces 300 MQLs. Historical cohorts show that 30 percent become SQLs within 60 days, and 25 percent of SQLs become customers.
The mature forecast is:
- 300 MQLs
- 90 expected SQLs
- 22.5 expected customers
At the end of March, only 35 SQLs and 5 customers may be visible. Calling the campaign a failure from those incomplete counts ignores the remaining bake. The forecast should compare the visible result with the historical completion curve, then revise the expected final result as the cohort develops.
Step 4: monitor actual pacing against plan
A forecast becomes useful when actual performance updates it. Compare month-to-date results with plan, a recent rolling average, and the expected stage of cohort maturity. A read-only Google Ads AI agent can prepare that daily pacing view and route anomalies to the operator without changing the account.
Upper-funnel metrics usually settle faster:
- Spend
- Clicks
- CPC
- Lead volume
- Cost per lead
Downstream metrics usually settle slower:
- SQL volume
- Opportunities
- Customers
- Revenue
- CAC and ROAS
Use fast metrics as early warnings, not final verdicts. If CPC rises 20 percent while the budget stays fixed, the click forecast should drop immediately. If lead conversion holds, MQL volume will likely fall. The team can investigate auction pressure, mix, or creative before the revenue gap appears months later. A MECE marketing funnel analysis helps isolate the first node that moved off forecast before the team reacts to downstream symptoms.
For Google Ads planning, Performance Planner can model how spend and campaign changes may affect conversions or conversion value. Google says its forecasts refresh daily, use recent auction data, and account for seasonality and conversion delay. Treat it as a channel input, then connect the output to your own CRM funnel and finance assumptions.
Step 5: build conservative, base, and aggressive scenarios
A single-number forecast hides uncertainty. Three scenarios force the team to state what needs to be true for each outcome. External market estimates, including the global ad spend by channel data, belong in the assumptions layer, not as a substitute for the company’s own funnel history.
| Scenario | Use | Typical assumptions |
|---|---|---|
| Conservative | Protect cash and set the downside plan | Higher CPC, lower conversion, slower sales cycle |
| Base | Operating plan | Recent normalized rates plus committed changes |
| Aggressive | Capacity and upside planning | Proven improvements, enough budget, sales capacity available |
Do not create the aggressive case by adding 25 percent to every row. Name the mechanism. Maybe a landing-page test raises visit-to-MQL conversion. Maybe better offline conversion data improves lead quality. Maybe a new geography adds volume at a higher CPC.
Every adjustment should have an owner and evidence. If the assumption is still a test, keep it out of the base case until the result is repeatable.
Step 6: make scaling decisions with both signals
Increase spend when the fast indicators are on plan and the baked downstream forecast still clears the business target. Both conditions matter.
A useful decision table looks like this:
| Current pacing | Baked downstream forecast | Action |
|---|---|---|
| On plan | On plan | Scale within the scenario range |
| On plan | Below plan | Hold spend and inspect lead quality or sales conversion |
| Below plan | On plan | Check whether the upper-funnel miss is temporary or mix-related |
| Below plan | Below plan | Pause the increase, diagnose, and fix the constraint |
This is how forecasting stops teams from reacting to one dashboard. A lower cost per lead can still produce a worse customer forecast. A temporarily high CPA can still recover when conversion lag completes.
When Search is near its efficient ceiling, use the Performance Max versus Search framework to decide whether broader Google inventory has enough clean conversion signal to carry the next budget increase. Then map the added spend through a B2B demand generation strategy that sequences Search, PMax, Demand Gen, Meta, CTV, and direct mail by evidence rather than fixed percentages.
Common marketing forecasting mistakes
Forecasting only leads
Lead volume is not the business outcome. Keep cost per lead in the model, but connect it to qualification, customer conversion, and revenue.
Using one blended conversion rate
Brand, channel, geography, product, and customer type can behave differently. Segment where the decision changes.
Ignoring cohort delay
Recent periods are incomplete. Compare cohorts at the same age, or apply a completion curve before judging them.
Changing assumptions without recording why
A forecast is only auditable when the team can see which rate changed, who changed it, and what evidence supported the change. The same source, log, and approval discipline is the foundation of a reliable AI marketing workflow.
Treating the aggressive scenario as the target
The upside case exists to plan capacity and identify dependencies. It is not the base plan with a more motivating label.
Forgetting sales capacity
Marketing can hit its lead forecast while revenue misses because sales response time, staffing, or close capacity falls behind. Include operating constraints outside the ad account.
When not to increase the budget
Do not increase spend because the month-to-date lead count is ahead. Hold the increase when the cohort is too young, qualification rates are falling, CRM stages are unreliable, sales capacity is constrained, or the base case depends on an unproven conversion lift.
Fix the signal before scaling it. TNT Growth’s Google Ads call tracking case study shows why platform conversions can rise while first-time customers fall when the campaign optimizes toward the wrong event.
How to build your first marketing forecast
- Export 12 to 24 months of media, CRM, customer, and revenue data.
- Segment the history by the dimensions that change decisions.
- Define every funnel stage and calculate stage conversion rates.
- Measure how long each cohort takes to reach SQL, opportunity, customer, and revenue.
- Build conservative, base, and aggressive assumptions.
- Calculate monthly spend, volume, customer, CAC, and revenue outputs.
- Compare actual pacing with plan every week.
- Update assumptions when evidence changes, not when the target feels uncomfortable.
The takeaway
Marketing forecasting is a full-funnel operating system. Start with real history, calculate each stage, model the time conversions need to mature, and show more than one outcome. Then use fast pacing metrics and baked downstream expectations together before changing spend.
A useful forecast does not promise precision. It makes assumptions visible and gives the team a better decision before the final revenue number arrives.
TNT Growth connects paid media to CRM and revenue data for brands spending $75K+/mo. Review our growth and tracking services, see client results measured beyond platform leads, or book a 30-minute ad audit to find the constraint your current forecast misses.
Frequently asked questions
What is marketing forecasting?
Marketing forecasting estimates future spend, traffic, leads, pipeline, customers, and revenue using historical performance, funnel conversion rates, conversion delay, seasonality, and planned changes. A useful forecast shows the assumptions behind the result and updates as actual performance arrives.
How much historical data do you need for a marketing forecast?
Start with 12 to 24 months when that history is available, segmented by channel, brand versus non-brand, geography, and product line. A newer business can forecast with less data, but it should use wider scenario ranges and avoid treating one recent month as a stable baseline.
How do you forecast revenue from marketing leads?
Map each funnel stage from lead to qualified lead, opportunity, customer, and revenue. Apply historical stage conversion rates by cohort and account for the time each stage takes to mature. Forecasted revenue should come from expected customers multiplied by a verified revenue or lifetime-value assumption.
What is cohort bake in marketing forecasting?
Cohort bake is the time required for a group of leads to progress through the funnel. A March lead cohort may not produce its final SQL, opportunity, and customer count until May or June. Bake analysis estimates the eventual result before every lead finishes converting.
When should you increase marketing spend based on a forecast?
Increase spend when fast upper-funnel indicators are on plan and the baked downstream forecast still clears the customer, CAC, or revenue target. If CPC, lead quality, conversion rate, or expected downstream volume is deteriorating, diagnose the gap before adding budget.