
Marketing funnel analysis should find the first metric that broke, not merely confirm that CPA went up. The MECE framework makes each possible cause separate and keeps the full set of causes visible. Forecast every funnel node, compare actuals with plan, move upward from the outcome, rule out impossible explanations, and test one fix at a time.
What MECE means in marketing funnel analysis
MECE stands for mutually exclusive and collectively exhaustive. Mutually exclusive means each branch describes a separate cause, so one issue is not counted twice. Collectively exhaustive means the branches cover the whole problem, so an important cause cannot sit outside the tree unnoticed.
The framework is closely associated with McKinsey’s problem-solving culture. McKinsey describes MECE as one of its most applicable frameworks for structuring thought. For paid media, the useful part is not the consulting vocabulary. It is the discipline of breaking a high CPA into a complete set of measurable inputs.
A basic ecommerce acquisition tree might include:
| Funnel layer | Example metric | What it can reveal |
|---|---|---|
| Auction | CPC, impression share | Competition, bids, eligibility, or budget pressure |
| Ad response | CTR | Creative fatigue, weak relevance, or audience mismatch |
| Site engagement | Click-to-cart CVR | Landing-page friction, message mismatch, or traffic quality |
| Checkout | Cart-to-purchase CVR | Offer, payment, shipping, or technical friction |
| Unit economics | AOV, CAC, ROAS | Whether the full system clears the business target |
A B2B tree replaces cart and purchase with qualified lead, opportunity, and closed customer. If the account optimizes to form fills but the business cares about revenue, the tree is incomplete. Our guide to choosing the right Google Ads conversion action explains why the platform goal should reflect the deepest event you can measure reliably.
Step 1: forecast every funnel node by channel
A useful diagnosis begins before performance drops. Write the expected value for each material funnel metric before the budget is spent, then do it separately for each channel and campaign type.
For example, do not blend Google brand, Google non-brand, Performance Max, Demand Gen, Meta prospecting, and retargeting into one paid-media average. Their auction costs, intent, conversion paths, and expected economics differ. One healthy channel can hide another channel’s failure inside a blended total.
The source framework tracks CPC, CTR, click-to-cart conversion rate, cart-to-purchase conversion rate, CAC, average order value, and ROAS. A B2B version might use:
- Spend
- CPC
- CTR
- Click-to-lead conversion rate
- Lead-to-qualified-lead rate
- Qualified-lead-to-opportunity rate
- Opportunity-to-customer rate
- CAC and revenue
Each number needs a source and an owner. Media metrics can come from the ad platform. Site conversion comes from analytics or the product database. Qualification and revenue usually come from the CRM. If two systems disagree, document which one governs the decision before diagnosing performance.
This is where a full marketing forecasting model becomes useful. A forecast gives the team a baseline for each stage instead of forcing the analyst to decide whether a number is good only after it changes.
Step 2: compare actual performance with the forecast
The first meaningful gap between actual and forecast is the constraint. Downstream metrics may look bad because that earlier node moved, but they are symptoms until proven otherwise.
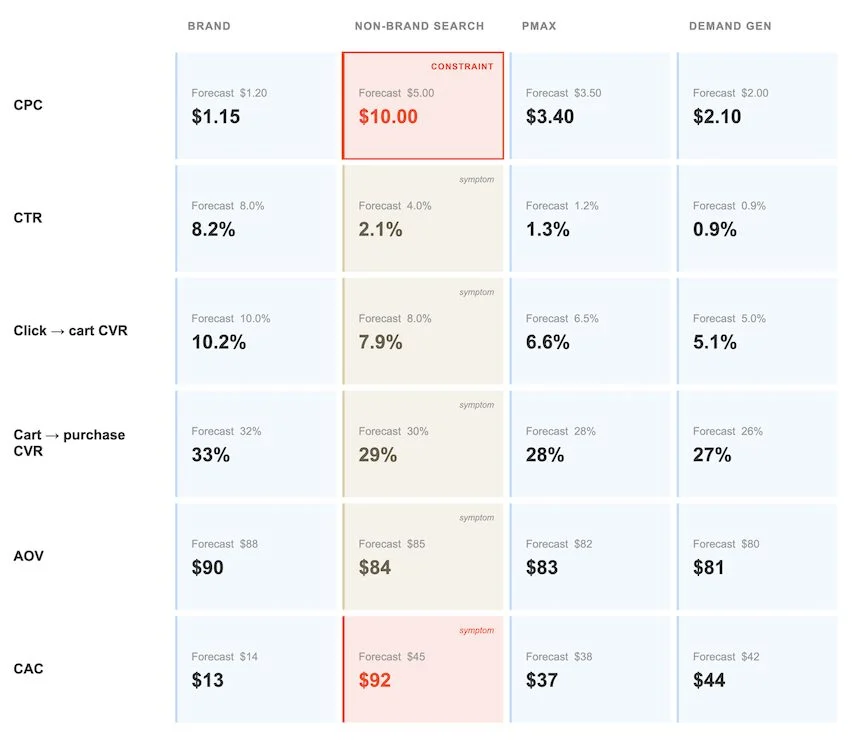
Suppose non-brand Search was forecast to run at a $5 CPC and the actual CPC is $10. CAC is also above plan. The mistake is to begin at CAC and brainstorm every possible reason acquisition became expensive. Start with CPC because it is the first observed break in the chain.
The comparison should show forecast and actual in the same table:
| Metric | Forecast | Actual | Initial read |
|---|---|---|---|
| CPC | $5.00 | $10.00 | First clear constraint |
| CTR | 4.0% | 2.1% | Possible upstream cause of expensive clicks |
| Click-to-cart CVR | 8.0% | 7.9% | Near plan, likely not the primary break |
| Cart-to-purchase CVR | 30% | 29% | Near plan, likely a symptom at most |
| CAC | $45 | $92 | Business outcome affected by the earlier gap |
The table prevents a common failure: treating every red metric as a separate project. If CTR falls, CPC rises, and CAC doubles in the same period, three metrics are off plan, but one root cause may explain all three.
When no forecast exists, use history as the baseline. Pull the same funnel for the prior 18 months and identify the week when the trend changed. A rolling average can help reduce noise, but keep the raw weekly view so a sharp break is not smoothed away.
Step 3: walk upward from the outcome
Walking upward means tracing the expensive outcome back through each preceding node until you find the first point of divergence. It turns “CPA is high” into a dated, measurable diagnosis.
In Adam’s example, cost per checkout initiated had stayed near $10 for months, then doubled in one week and remained high. Cost per app install rose during the same week, from roughly $2.50 to $4. One node further up, CPC spiked and CTR fell. Budget stayed flat, and the change history showed no account edits during the month.
That sequence matters:
| Observation | Timing | Role in the diagnosis |
|---|---|---|
| Cost per checkout doubled | Same week | Downstream outcome |
| Cost per install rose from about $2.50 to $4 | Same week | Intermediate symptom |
| CPC increased | Same week | Upstream constraint |
| CTR fell | Same week | Strong clue about ad response |
| Budget stayed flat | No change | Rules out budget growth as the trigger |
| Account change history was clean | No edits that month | Weakens targeting and setup hypotheses |
Google Ads’ performance explanations follow a related diagnostic idea. They can surface shifts in conversion settings, conversion delay, CTR, search volume, eligibility, assets, and change history. Use them as evidence, not as a substitute for the business funnel that continues beyond the platform.
Step 4: rule out causes until one survives
A good hypothesis must be capable of moving the first broken node on the date it changed. If it cannot, remove it from the tree.
The example began with several possibilities: new creative, a targeting change, creative fatigue, brand fatigue, a landing-page edit, or a price change. Then the evidence narrowed the list.
- A price change would not directly explain a simultaneous CTR drop and CPC spike, so it moved down the list.
- No account edits weakened the targeting-change hypothesis.
- No landing-page edit weakened the site-change hypothesis.
- Budget was flat, so rapid spend expansion was not the trigger.
- CTR fell while the setup stayed stable, leaving creative or audience fatigue as the strongest surviving explanation.
This is where MECE helps. “Creative issue,” “audience issue,” “auction issue,” “site issue,” “tracking issue,” and “sales issue” are useful top-level branches because they are distinct enough to test. A loose list such as “bad ads,” “weak message,” and “creative fatigue” double counts the same branch and creates the illusion of three explanations.
Step 5: fix one node and read it again
The diagnosis is not finished when the team agrees on a plausible story. Change one thing that should affect the broken node, then measure that same node again.
If creative fatigue is the leading cause, introduce a controlled creative refresh while holding targeting, budget, bid strategy, landing page, and conversion definition stable where possible. Our Meta ads scaling framework separates budget increases from new message angles and formats so the refresh tests a clear hypothesis. If CTR recovers and CPC moves toward forecast, the evidence supports the diagnosis. If neither metric changes, eliminate that branch and continue.
Changing five things at once may improve performance, but it destroys the learning. The team cannot tell which change worked, which did nothing, or which created a new problem. The next downturn starts from zero because no causal knowledge was preserved.
Our Google Ads optimization matrix uses the same operating principle: match the fix to the constraint instead of applying the same optimization checklist to every account.
Common marketing funnel analysis mistakes
Most weak diagnoses fail because the data or the sequence is wrong, not because the analyst needs more metrics.
Starting with the loudest outcome
CPA and ROAS define the problem but rarely reveal the cause. Move upward until the first broken input appears.
Mixing channels or conversion windows
Brand Search and Demand Gen should not share one expected CPC or conversion rate. Diagnose each channel separately. Compare cohorts at the same maturity point so open B2B opportunities do not look like failed customer conversion.
Trusting broken or thin measurement
If a tag stopped firing or the CRM definition changed, the tree reflects reporting damage rather than customer behavior. A small account can also swing sharply from one conversion. Audit measurement, use longer windows when volume is thin, and consult the Google Ads metrics guide before changing media.
When not to use this framework
MECE funnel analysis is a poor fit when the measurement foundation is unstable. Pause the diagnosis if tracking is incomplete, key events changed definitions, revenue is missing, or the reporting window is shorter than the normal sales cycle.
It is also unnecessary when the cause is already verified. If the site was offline for six hours and conversion volume fell during those same six hours, the next action is to fix uptime, not build a larger issue tree.
Use the framework when multiple plausible causes remain.
How to run a MECE funnel analysis yourself
Use this operating checklist:
- Map every material stage from spend to revenue.
- Separate channels and campaign types with different economics.
- Write forecast, actual, and variance for each metric.
- Find the earliest date when performance moved off plan.
- Identify the first funnel node that diverged.
- Review change history, site releases, offers, pricing, inventory, and sales-process changes around that date.
- Group hypotheses into non-overlapping branches.
- Remove any cause that could not affect the broken node.
- Change one variable tied to the strongest remaining cause.
- Read the same metric again before making the next change.
The output should be a short decision record: the broken node, the date, the evidence, the leading hypothesis, the test, and the result. That record makes the next diagnosis faster because the team can compare patterns.
The takeaway
Marketing funnel analysis is most useful when it turns a broad complaint into one testable constraint. Forecast every node, compare actuals with plan, move upward from CPA or ROAS, rule out causes that cannot explain the first break, and change one thing at a time.
If your paid-media reporting stops at platform CPA, TNT Growth can connect the ad account, site, CRM, and revenue data into one operating view. See our growth marketing services, review the results we have produced, or book a call to identify the first broken node in your funnel.
Frequently asked questions
What is marketing funnel analysis?
Marketing funnel analysis compares the expected and actual performance of each stage between ad spend and revenue. The goal is to find the first metric that moved off plan, because downstream problems such as high CPA are often symptoms of an earlier change in CPC, CTR, conversion rate, qualification, or sales performance.
What does MECE mean in marketing?
MECE means mutually exclusive and collectively exhaustive. In marketing analysis, each possible cause should sit in one distinct branch, while the complete tree covers every material cause. This reduces double counting and makes it harder for a problem to hide outside the analysis.
How do you find the cause of a high CPA?
Map the full funnel, compare each actual metric with its forecast or historical baseline, and identify the first node that diverged. Then inspect the date of the break, review account and site changes, rule out causes that could not affect that node, and test one remaining hypothesis at a time.
Which funnel metrics should paid media teams track?
At minimum, track spend, CPC, CTR, click-to-conversion rate, the conversion rates between meaningful downstream stages, CAC or CPA, average order value, and ROAS. B2B teams should also include qualified leads, opportunities, close rate, and revenue so cheap but weak leads do not look successful.
When should you not use a MECE funnel analysis?
Do not force a precise diagnosis when tracking is broken, conversion definitions changed, volume is too low, or the reporting window is shorter than the normal conversion delay. Fix the measurement foundation or wait for enough data before treating a temporary fluctuation as a structural problem.