
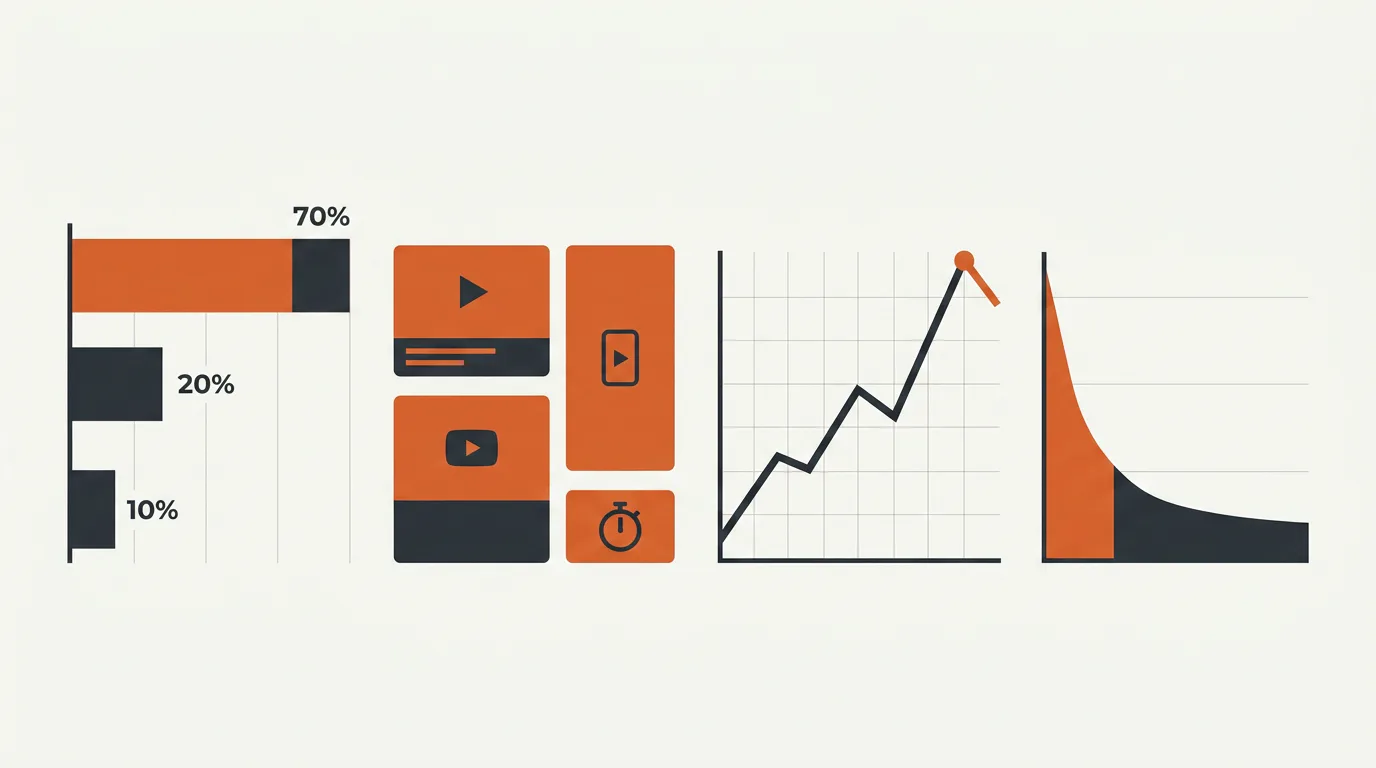
YouTube ads benchmarks are only useful when they are tied to format, objective, and downstream results. Across roughly $700K per month in managed YouTube spend, our practical baseline is a 70/20/10 creative budget, format-specific measurement, strong first-three-second hooks, and cost ranges treated as diagnostics rather than goals. The final judge is qualified CPA, revenue, or measured lift.
What these YouTube ads benchmarks cover
The numbers in this guide come from operating accounts with about $700K per month in YouTube spend at the time of the original analysis. They are not universal industry averages. A B2B lead-generation campaign, an ecommerce prospecting campaign, and a brand-lift campaign can all produce different cost and view patterns while each is working correctly.
Use benchmarks to spot anomalies and set test expectations. Do not turn them into automatic pass-fail rules. For the wider market context around Search, social, YouTube, streaming TV, and creator media, see our global ad spend by channel breakdown.
The most useful comparison set includes:
- Budget split between proven, iterative, and experimental creative
- Spend by long-form, Shorts, bumper, and in-feed formats
- Format-specific view rate and cost per view
- Hold rate in the first few seconds
- Qualified CPA or revenue by creative concept
- Branded search, direct traffic, or lift after exposure
Google’s YouTube view metrics guide notes that view definitions differ by format. That distinction matters before you compare one campaign or creative against another.
YouTube ads benchmarks at a glance
| Area | Working benchmark from our accounts | How to use it |
|---|---|---|
| Creative budget | 70% proven, 20% variations, 10% experiments | Protect winners while funding the next cycle |
| Long-form in-stream | 50% to 60% of format spend | Use for explanation, consideration, and conversion |
| Shorts | 20% to 30% of format spend | Use for cheaper reach and fast hook testing |
| Bumpers and in-feed | 10% to 20% of format spend | Use as supporting reach and B2B inventory |
| Typical CPV range | $0.02 to $0.30 | Segment by format and industry before judging |
| Typical CPM range | $4 to $10 | Compare reach economics, not lead quality alone |
| Shorts CPM range | $2 to $5 | Expect cheap reach, then verify downstream value |
| Curiosity-led hooks | 35% higher hold rate in our testing | Test the opening before rebuilding the whole ad |
These are observed operator ranges from the source accounts. Auction conditions, audience, geography, creative, bidding, and conversion goal can move them substantially.
The 70/20/10 YouTube creative budget
A YouTube program needs two things at the same time: enough budget on known winners to hit the current target, and enough testing to replace those winners before fatigue appears.
The 70/20/10 model creates that balance.
70 percent on proven creative
Keep most spend on ads that are beating the account forecast or target. Scale them while they hold conversion efficiency, view quality, and downstream results.
A proven ad has enough spend and conversion delay to show that it attracts the right audience and contributes to the business goal. Watch for fatigue through falling click-through rate, rising CPA, weaker hold rate, and repeated frequency. Move a fading winner into the variation track before it collapses.
20 percent on variations of winners
Variations reduce risk because they change one part of an idea that already works. Test a new opening line, first visual, proof point, call to action, aspect ratio, pacing, or shorter Shorts cut. Across our testing, this bucket often produced a 15 to 20 percent engagement lift. Preserve the winning mechanism and change one variable at a time.
10 percent on new concepts
Use the smallest bucket for ideas with no evidence yet. That might be creator-led content, a new problem angle, a documentary-style customer story, or an unexpected visual hook.
Most experiments should fail. In the source accounts, roughly 70 percent of this bucket did not become scalable winners. That is acceptable. The point is to discover the few concepts that graduate into the next 70 percent.
A team that only funds proven ads eventually runs out of proven ads. A team that spends half the budget on experiments creates unnecessary volatility. Ten percent buys learning without risking the account.
YouTube ads benchmarks by format
Different YouTube formats have different jobs and different view definitions. Compare them within their role before you compare them against each other.
Long-form skippable in-stream: 50 to 60 percent
Long-form in-stream carried the largest share of format spend in the source accounts. It can explain a complex B2B offer, demonstrate a product, tell a customer story, and build enough context for a high-consideration conversion.
Google says skippable in-stream viewers can skip after five seconds. Under cost-per-view bidding, a billable view generally occurs when someone watches 30 seconds, watches the full ad if it is shorter, or interacts with it. See Google’s video ad format definitions for the current rules.
That makes the opening critical. The ad has to earn the next five seconds before it can earn the next minute.
YouTube Shorts: 20 to 30 percent
Shorts can buy inexpensive mobile reach and gives teams a fast place to test hooks. In the source accounts, Shorts often ran at roughly $2 to $5 CPM compared with $4 to $10 for broader YouTube inventory.
Do not read that as “Shorts is twice as efficient.” It is cheaper reach. Conversion rate and lead quality can still differ.
Google recommends vertical, sound-on creative that feels native to the Shorts feed. It also explains that a TrueView view on Shorts is counted after 10 seconds, the end of a shorter ad, or a qualifying interaction. Those rules differ from in-stream, so compare format-specific columns rather than one blended view rate. Google’s Shorts asset guidance is the reference.
Bumpers and in-feed: 10 to 20 percent
Bumpers and in-feed ads filled a smaller supporting role. Bumpers can reinforce a message in six seconds. In-feed can reach people while they browse or search video content and may work well for narrower B2B topics.
Use them when the format matches the message. Do not force a two-minute explanation into a bumper or judge a six-second reminder by the same direct-response standard as a detailed in-stream demonstration.
The first three seconds decide whether the benchmark matters
Media cost cannot rescue an opening people ignore. In our tests, curiosity-led hooks produced 35 percent higher hold rates than weaker openings.
A useful hook shows a specific result, names a familiar problem, opens a question, or demonstrates the outcome before explaining it. Google’s YouTube creative playbook also recommends fast early pacing and introducing the brand or product in the first five seconds. Test those first seconds before replacing the entire ad. If the opening loses viewers, the rest never gets a fair trial.
YouTube ads cost benchmarks need context
The source accounts commonly saw CPV between $0.02 and $0.30, with an average near the low end in broad inventory. CPM often ranged from $4 to $10, while Shorts could land around $2 to $5.
Those ranges are wide because YouTube cost depends on:
- Industry and audience scarcity
- Geography
- Format
- Bidding objective
- Creative quality
- Device and inventory
- Conversion history
- Campaign type
A finance or legal audience can cost more than a broad education audience. A conversion campaign can accept a higher CPM than a reach campaign if qualified CPA still works. A cheap CPV can be bad if viewers never progress.
Google’s cost-per-view documentation recommends setting bids against the delivery estimate shown during campaign setup, then adjusting based on actual delivery. That is more useful than copying a universal CPV target from another account.
How to judge YouTube ads beyond CPV and CPM
CPV and CPM explain media cost. They do not prove business impact.
For performance campaigns, compare:
- Qualified conversion rate
- Cost per qualified lead
- Customer acquisition cost
- Revenue or pipeline per dollar spent
- Assisted conversions
- Branded search and direct traffic after launch
For awareness and consideration, compare:
- Format-specific view rate
- Hold rate at key timestamps
- Search lift or survey lift where available
- Branded search volume
- Incremental reach
In one TNT Growth client study, YouTube exposure coincided with a 6 percent reduction in Search CAC. That does not mean every YouTube campaign lowers Search CAC. It shows why cross-channel measurement matters: YouTube can create intent that Search later captures.
Our guide to how YouTube ads actually work covers the targeting and attribution model in more detail.
Why “ugly” YouTube ads can work
High production value is not required for testing. We often start with repurposed Meta videos, founder clips, screen recordings, simple motion, testimonials, or slide-based explanations. These ads are direct and fast to iterate. Our YouTube ads for B2B validation playbook explains how to validate existing creative in the right formats, compare qualified CPA with Search, and invest in production around concepts that already work. Do not spend heavily before the hook, proof, and offer can win.
How to run a YouTube ads benchmark review
Use this monthly review to keep the program interpretable:
- Segment spend, views, and conversions by format.
- Compare format-specific view definitions, rates, and early hold.
- Label creative as proven, variation, or experiment.
- Check whether the 70/20/10 split still fits the evidence.
- Trace conversions into the CRM and review branded search after major flights.
- Promote winners, retire fatigue, and record what failed experiments taught you.
A benchmark review should end with a budget decision and a creative brief, not a dashboard screenshot.
When not to scale YouTube yet
Keep the test small when tracking is incomplete, Search does not reveal who converts, the budget cannot support a fair read, the team cannot produce variations, or sales cannot distinguish qualified leads. YouTube works best when the account connects exposure, Search behavior, and downstream results. Fix measurement before scaling media.
The takeaway
The useful YouTube ads benchmarks are not one CPV, CPM, or view-rate target. They are a system for allocating creative budget, comparing formats correctly, testing the first few seconds, and connecting media cost to qualified results.
Start with 70 percent on proven creative, 20 percent on variations, and 10 percent on experiments. Use Shorts for cheap reach and hook testing, long-form for explanation and conversion, and format-specific reporting for honest comparisons. Then judge the program on qualified CPA, revenue, or measured lift.
TNT Growth manages YouTube, Google Ads, conversion tracking, and landing-page testing for scaled accounts. Explore our paid-media services, review client results, or book a call to map the next YouTube test.
Frequently asked questions
What are good YouTube ads benchmarks?
Useful YouTube ads benchmarks depend on format, audience, objective, and conversion definition. Across the accounts behind this guide, CPV often ranged from $0.02 to $0.30 and CPM from roughly $4 to $10, while Shorts could run lower. Treat those as operator ranges, not universal targets, and judge campaigns on qualified CPA, revenue, and lift as well as media cost.
How should you split a YouTube ads creative budget?
We use a 70/20/10 model: 70 percent on proven creative, 20 percent on variations of winners, and 10 percent on genuinely new concepts. The split protects current performance while maintaining a steady testing pipeline. Move budget as fatigue appears and new winners earn enough evidence.
Are YouTube Shorts ads cheaper than in-stream ads?
Shorts often deliver cheaper reach and CPM because the format has broad mobile inventory, but cheap reach does not guarantee qualified conversions. Compare formats on the same business goal and use format-specific view metrics. Shorts, in-feed, and in-stream count views differently, so a single blended view rate can mislead.
Do high-production YouTube ads perform better?
Not automatically. We start many campaigns with repurposed Meta ads, founder videos, screen recordings, and simple motion creative. Message-audience fit and the opening hook matter more during validation. Invest in higher production after the campaign proves its economics and you know which angle deserves a larger creative bet.