
Performance Max channels do not follow one standard allocation. Across 53 accounts and 365 days, the median campaign put 61% of PMax spend into Search, but individual accounts ranged from 2% to 99%. The useful benchmark is not a target. It is a reason to pull your own channel report before assuming where PMax spends.
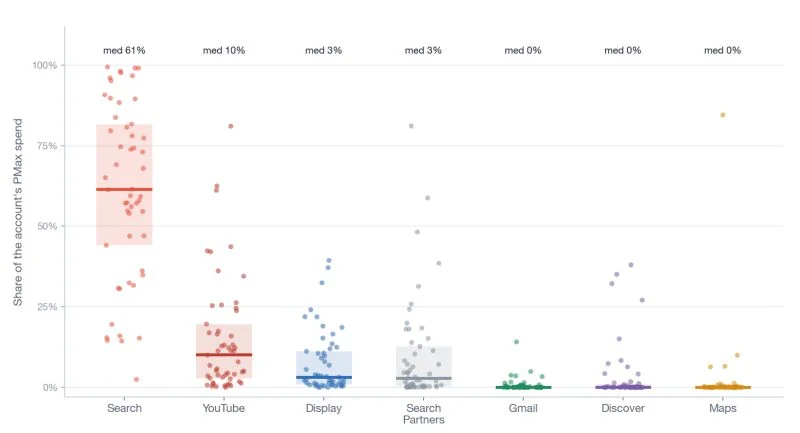
Performance Max channels benchmark at a glance
The 53-account data shows a heavy Search center with wide account-level variation. Search took a 61% median share of PMax spend. YouTube followed at 10%. Display and Search partners each landed at 3%. Gmail, Discover, and Maps each had a 0% median, although individual accounts still showed meaningful outliers.
| Performance Max channel | Median share of account PMax spend | Observed range or notable outlier | Operator read |
|---|---|---|---|
| Search | 61% | 2% to 99% | Most accounts leaned heavily toward Search, but the range was extreme |
| YouTube | 10% | Some accounts above 80% | Video can become a major allocation when assets, signals, and auctions support it |
| Display | 3% | Several accounts around 25% to 40% | A low median can hide material account-level delivery |
| Search partners | 3% | One account above 80% | Small typical share, but outliers deserve a quality check |
| Gmail | 0% | One account around 15% | Zero median does not mean the channel never receives spend |
| Discover | 0% | Several accounts around 25% to 40% | Distribution is concentrated, not uniformly absent |
| Maps | 0% | One account at 84% | Local intent can produce a completely different mix |
A median is the middle account after sorting the group. It is not the average, and it does not say how your next dollar should be allocated. Half the accounts sit above it and half below it. The spread matters as much as the midpoint.
This is also a cross-sectional benchmark, not a controlled before-and-after test. The chart describes where spend landed across the account set. It does not prove that one channel caused better performance or that moving toward the median would improve an account.
Why Search gets the largest share of PMax spend
Search often receives the largest PMax allocation because it captures explicit demand. A person types a query that signals a problem, product, provider, or next step. When the campaign has relevant pages, usable assets, and a conversion goal that Google can predict, Search inventory gives the system a direct path from stated intent to action.
Google defines Performance Max Search as ads served on Google Search and related Search surfaces. Its official channel definitions also make an important point: a channel can contain multiple ad formats. Channel labels describe where the ad served, not one fixed creative type.
A high Search share is not automatically a problem. It can be the correct result for an account with strong query demand and limited opportunity elsewhere. The diagnostic question is whether PMax is finding incremental, qualified demand or mostly reproducing traffic the existing Search program already captures.
In our operating process, a campaign above roughly 90% Search starts to look more like an automated Search extension than a balanced cross-channel campaign. That 90% line is an operator checkpoint, not a Google requirement. It prompts three checks:
- Are the PMax search terms already covered by Search campaigns?
- Do PMax conversions become qualified pipeline or revenue?
- Is another channel absent because it lacks assets or because Google predicts weaker return there?
If PMax is finding repeatable, qualified query themes, move the strongest themes into a controlled Search structure with specific ads and landing pages. Our Performance Max and Search scaling loop explains how to do that without shutting off the exploration campaign.
What the other Performance Max channels tell you
A low median does not make a channel unimportant. It means at least half the accounts had little or no spend there. The outliers show why account-level review matters.
YouTube: 10% median, with major outliers
YouTube received a 10% median share, but some accounts put more than 80% of PMax spend there. That spread can come from the available video and image assets, audience signals, conversion history, campaign economics, and the auctions Google predicts can meet the goal.
Do not judge YouTube by production value alone. Start with clear, usable assets that state the problem and offer quickly. Then compare qualified CPA with Search, watch brand demand, and account for conversion delay. If YouTube holds the business outcome, invest in stronger creative after the economics are proven.
Display: 3% median, but not always small
Display also had a 3% median, while several accounts reached roughly 25% to 40%. Display delivery deserves a placement and lead-quality review because cheap reach can make top-line platform metrics look better without producing useful customers.
Check where ads appeared, what conversion action received credit, and whether the resulting leads reached the CRM stage used for bidding. A low platform CPA does not rescue poor qualification.
Search partners: 3% median, with one account above 80%
Search partners sat at a 3% median, but one account exceeded 80%. That account-level outlier is exactly why the new reporting matters. Google added specific Search partner visibility to Performance Max channel reporting after making the broader report available across PMax campaigns.
If Search partner share rises, inspect placement reporting and downstream quality. Google documents the channel report and Search partner visibility in its Performance Max reporting update. The report tells you where delivery occurred. Your CRM tells you whether the traffic produced customers.
Gmail, Discover, and Maps: 0% medians with real exceptions
A 0% median means the middle account had no material allocation to that channel. It does not mean the channel was absent from every account. Discover showed several accounts near 25% to 40%, Gmail had an account around 15%, and Maps had one account at 84%.
Maps is the clearest reminder that campaign context changes everything. A location-driven campaign can look nothing like a national B2B account. Comparing both to one universal mix would create bad advice.
How to read your Performance Max channel report
The best use of the benchmark is to create questions for your own account. Google’s channel performance report includes a campaign summary, channels-to-goals chart, time-series view, distribution table, and status diagnostics.
Run this review in order:
- Confirm the business goal. Judge qualified leads, customers, revenue, or another downstream result before channel CPA.
- Pull a mature date range. Use enough history to cover normal conversion delay and avoid reacting to a few days of allocation.
- Compare your mix with the benchmark. Treat differences as questions, not failures.
- Check the status column. Missing video, images, feed data, business information, policy approval, or URL settings can limit eligibility.
- Inspect the outlier channel. Review search terms, placements, assets, formats, and change history.
- Reconcile with the CRM. Separate platform conversions from qualified outcomes.
- Change one connected input. Document the date, wait through the conversion cycle, and read the channel timeline again.
Google says that if a channel has no eligibility issue and still receives little spend, PMax may simply be prioritizing inventory it predicts will deliver better return for the current goal, target, and budget. No spend is not proof that the campaign is broken.
Our broader Performance Max reporting guide covers the report controls, diagnostics, and common interpretation mistakes. Use this benchmark beside that guide, not instead of it.
Common mistakes when comparing PMax channel mix
Treating the median as the correct allocation
The median describes the dataset. It does not prescribe a healthy mix. A local campaign, ecommerce feed, high-CPA B2B account, and national healthcare advertiser can have very different eligible inventory and conversion paths.
Calling every high Search share duplication
Search concentration can be profitable. Check query overlap, brand demand, qualified outcomes, and whether the existing Search campaigns can reproduce the result before moving budget or excluding traffic.
Ignoring missing assets and eligibility
Google’s status diagnostics can flag missing required assets, disapprovals, feed problems, budget constraints, and other limits. Fixing eligibility gives the campaign an option to serve. It does not guarantee spend.
Comparing channels on platform CPA alone
Channel reporting is attribution reporting, not an incrementality test. A channel can receive credit without creating a customer who would otherwise not exist. Use CRM stages, new-customer reporting, holdouts, or lift tests when causality matters.
Changing goals, budget, assets, and targets at once
A bundle of changes destroys the diagnostic trail. Make one connected change, record it, and use the time-series view to see whether allocation and qualified performance moved together.
When not to use Performance Max
Do not use PMax when the business requires fixed channel budgets, strict placement control, or message approval that cross-channel automation cannot meet. It is also a poor fit when conversion tracking is shallow, lead quality cannot be sent back, or the account lacks enough evidence to judge outcomes after conversion delay.
Before increasing spend, run the Performance Max audit checklist. A broader channel mix will not fix a campaign trained on spam, duplicate conversions, weak URLs, or the wrong business goal.
The takeaway
Performance Max channels vary more than most benchmark charts suggest. Search held a 61% median share across 53 accounts, but the 2% to 99% range makes a universal target useless. YouTube, Display, Search partners, Discover, Gmail, and Maps all produced account-level outliers that would disappear inside one average.
Pull your own report. Start with the business outcome, check channel eligibility, inspect the outlier, and compare platform conversions with qualified results. Use the benchmark to ask better questions, not to force every campaign toward the same mix.
TNT Growth manages Google Ads, conversion tracking, and landing-page testing for brands spending $75K+/mo. Review our paid-media and tracking services, see results tied to revenue, or book a free 30-minute ad audit to diagnose where your Performance Max budget is going.
Frequently asked questions
Which channels does Performance Max use?
Performance Max can serve across Search, Maps, YouTube, Discover, Gmail, and the Google Display Network. Google's channel reporting also separates Search partners. The exact mix depends on each campaign's goals, assets, feeds, audience signals, conversion data, targets, budget, eligibility, and available auctions.
How much Performance Max spend goes to Search?
Across the 53 accounts in this 365-day benchmark, the median account put 61% of Performance Max spend into Search. The range was 2% to 99%, so 61% is a descriptive midpoint, not a target. Pull your own channel report before judging whether your campaign's Search share is healthy.
Is a high Performance Max Search share bad?
Not automatically. A high Search share can produce strong results. It becomes a useful diagnostic when Performance Max mostly duplicates demand already handled by Search, hides weak query quality, or stops exploring other inventory. Compare qualified outcomes, query themes, channel eligibility, and overlap with existing Search campaigns before changing anything.
Can you control Performance Max spend by channel?
Performance Max does not provide direct channel budgets. Google allocates spend across eligible auctions based on predicted campaign return. Operators can influence eligibility and direction through conversion goals, assets, feeds, search themes, audience signals, brand controls, URL rules, and account-level exclusions, but those inputs do not guarantee a fixed channel mix.
Where can I see Performance Max channel reporting?
In Google Ads, open Campaigns, select Insights and reports, then choose Channel performance. The report includes a campaign summary, a channels-to-goals view, a time-series chart, and a channel distribution table. Check the status column for missing assets, policy issues, budget limits, or other eligibility diagnostics.